RSS - Stimulsoft
RSS: Stimulsoft Reports Fx for Flex
 http://www.stimulsoft.com/en/rss
Publisher: Stimulsoft
RSS - Stimulsoft
Events in the reporting tool for JavaScript. Part 2: Viewer events.
Thu, 18 Apr 2024 11:13:45 -0400

In this article, we present a comprehensive guide to viewer events in the JS reporting tool, encompassing their detailed descriptions, lists of arguments, and much more. In the last article we talked about report events, and in this one we’ll talk about viewer events.
onPrepareVariables
The event is triggered at the beginning of report construction, before populating the variables in the report. It occurs immediately after processing the onPrepareVariables event on the StiReport instance. Below is the list of event handler arguments:
onBeginProcessData
The event is triggered before requesting the data needed to build the report. It occurs immediately after processing the onBeginProcessData event on the StiReport instance. Below is a list of event handler arguments:
onEndProcessData
The event is triggered after receiving the data necessary to build the report. It occurs immediately after processing the onEndProcessData event on the StiReport instance. Below is a list of event handler arguments:
onPrintReport
It is used to modify the report before printing or to implement custom printing functionality.
The event is triggered before the report is printed. Below is a list of event handler arguments:
onBeginExportReport
It is used to adjust export settings or modify the report before exporting.
The event is triggered before the report is exported, but after the export settings specified in the dialog box have been set. Below is a list of event handler arguments:
onEndExportReport
It is used to implement file saving independently.
The event is triggered after the report is exported but before the file is saved. Below is a list of event handler arguments:
onInteraction
The event is triggered before interactivity takes place. Below is a list of event handler arguments:
onEmailReport
It is used to send an exported report via email.
The event is triggered before the report is sent via email. Below is a list of event handler arguments:
onDesignReport
It is used to display the designer and transfer the report template.
The event is triggered when the Design button is clicked. Below is a list of event handler arguments:
onShowReport
It is used to modify the report before displaying it in the viewer.
The event is triggered after the report is built but before it is displayed in the viewer. Below is a list of event handler arguments:
onOpenReport
It is used to implement your own method of opening templates.
The event is triggered before the report file selection dialog box opens and before it is sent to the viewer. Below is a list of event handler arguments:
onOpenedReport
It is used to modify the report before transmitting it to the viewer.
The event is triggered after the report is opened but before it is sent to the viewer. Below is a list of event handler arguments:
Viewer events
The event is triggered at the beginning of report construction, before populating the variables in the report. It occurs immediately after processing the onPrepareVariables event on the StiReport instance. Below is the list of event handler arguments:
{
    event: "PrepareVariables",
    sender: "Viewer",
    report: StiReport,

    preventDefault: boolean,
    async: boolean,

    variables: []
}viewer.onPrepareVariables = (args, callback) => {
args.variables[0].value = "Replace value";
}The event is triggered before requesting the data needed to build the report. It occurs immediately after processing the onBeginProcessData event on the StiReport instance. Below is a list of event handler arguments:
{
    sender: "Viewer",
    event: "BeginProcessData",
    report: StiReport,

    preventDefault: boolean,
    async: boolean,

    command: string,
    database: string,
    connection: string,

    headers: [],
    withCredentials: string,

    // Json
    pathData: string,
    tryParseDateTime: boolean,
    relationDirection: StiRelationDirection,

    // Xsd
    pathSchema: string,

    // Xml
    pathData: string,
    tryParseDateTime: boolean,
    relationDirection: StiRelationDirection,

    // Excel
    pathData: string,
    firstRowIsHeader: boolean,

    // OData
    connectionString: string,
    dataSource: string,
    collectionName: string,

    // Sql
    connectionString: string,
    dataSource: string,
    queryString: string,
    timeout: number,
    parameters: { name: string, value: string | number }[],
    escapeQueryParameters: boolean,

    // Gis
    pathData: string,
    separator: string,
    dataType: StiGisDataType,

    // Csv
    pathData: string,
    separator: string,
    codePage: number,

    // DBase
    pathData: string,
    codePage: number
}viewer.onBeginProcessData = (args) => {
if (args.database == "MySQL")
args.connectionString = "new connection string";
}viewer.onBeginProcessData = (args, callback) => {
if (args.database == "MySQL"){
args.preventDefault = true;
var result = {
success: true,
rows: [
["value1", 1, false],
["value2", 1, true],
["value3", 2, false]
],
columns: [
"Column1_name",
"Column2_name",
"Column3_name"
],
types:[
"string",
"int",
"boolean"
]
}
// https://github.com/stimulsoft/DataAdapters.JS/
callback(result);
}
}The event is triggered after receiving the data necessary to build the report. It occurs immediately after processing the onEndProcessData event on the StiReport instance. Below is a list of event handler arguments:
{
    sender: "Viewer",
    event: "EndProcessData",
    report: StiReport,

    command: string,
    dataSource: string,
    connection: string,
    database: string,

    result: DataSet|any
}viewer.onEndProcessData = (args) => {
if (args.command == "ExecuteQuery" && args.dataSource == "Categories")
args.result.rows.push(rowData) ;
// https://github.com/stimulsoft/DataAdapters.JS/
}It is used to modify the report before printing or to implement custom printing functionality.
The event is triggered before the report is printed. Below is a list of event handler arguments:
{
    sender: "Viewer",
    event: "PrintReport",
    report: StiReport,

    preventDefault: boolean,
    async: boolean

    printAction: string,
}
viewer.onPrintReport = (args) => {
    var page = args.report.renderedPages.getByIndex(0);
    var image = page.components.getByName("Image1");
    if (image)
        page.components.remove(image);
}It is used to adjust export settings or modify the report before exporting.
The event is triggered before the report is exported, but after the export settings specified in the dialog box have been set. Below is a list of event handler arguments:
{
    sender: "Viewer",
    event: "BeginExportReport",
    report: StiReport

    preventDefault: boolean,
    async: boolean,

    action: StiExportAction,
    settings: IStiDashboardExportSettings | StiExportSettings,
    format: StiExportFormat,
    formatName: string,
    fileName: string,
    openAfterExport: boolean,
}viewer.onBeginExportReport = (args) => {
if (args.format == Stimulsoft.Report.StiExportFormat.Pdf)
args.settings.imageQuality = 0.5;
}It is used to implement file saving independently.
The event is triggered after the report is exported but before the file is saved. Below is a list of event handler arguments:
{
    sender: "Viewer",
    event: "BeginExportReport",
    report: StiReport,

    preventDefault: boolean,
    async: boolean,

    action: StiExportAction,
    format: StiExportFormat,
    formatName: string,
    fileName: string,
    openAfterExport: boolean,
    data: string | number[]
}viewer.onEndExportReport = (args) => {
args.fileName = "SampleFileName.txt";
}The event is triggered before interactivity takes place. Below is a list of event handler arguments:
{
    sender: "Viewer",
    event: "Interaction",
    report: StiReport,

    preventDefault: boolean,
    async: boolean,

    action: string,
    variables,
    sortingParameters,
    collapsingParameters,
    drillDownParameters,
    filteringParameters
}viewer.onInteraction = (args) => {
if (args.action == "Variables")
args.variables["Variable1"] = "New Value";
}It is used to send an exported report via email.
The event is triggered before the report is sent via email. Below is a list of event handler arguments:
{
    sender: "Viewer",
    event: "EmailReport",
    report: StiReport,

    settings: {
        email: string;
        subject: string;
        message: string;
    },
    format: StiExportFormat,
    formatName: string,
    fileName: string,
    data: number[] | string
}viewerOptions.toolbar.showSendEmailButton = true;viewer.onEmailReport = (args) => {
var emailAddress = args.settings.email;
var emailMessage = args.settings.message;
var emailSubject = args.settings.subject;
var emailAttachmentFileName = args.fileName;
var emailAttachment = args.data;
sendEmail(emailAddress, emailMessage, emailSubject, emailAttachmentFileName, emailAttachment);
}It is used to display the designer and transfer the report template.
The event is triggered when the Design button is clicked. Below is a list of event handler arguments:
{
    sender: "Viewer",
    event: "DesignReport",
    report: StiReport
}viewerOptions.toolbar.showDesignButton = true;var viewerOptions = new Stimulsoft.Viewer.StiViewerOptions();
viewerOptions.toolbar.showDesignButton = true;
var viewer = new Stimulsoft.Viewer.StiViewer(viewerOptions, "StiViewer", false);
viewer.renderHtml("content");
viewer.onDesignReport = (args) => {
var viewerDiv = document.getElementById("content");
viewerDiv.innerHTML = "";
var designerOptions = new Stimulsoft.Designer.StiDesignerOptions();
designerOptions.appearance.fullScreenMode = true;
var designer = new Stimulsoft.Designer.StiDesigner(designerOptions, "StiDesigner", false);
designer.renderHtml("content");
designer.report = args.report;
}It is used to modify the report before displaying it in the viewer.
The event is triggered after the report is built but before it is displayed in the viewer. Below is a list of event handler arguments:
{
    sender: "Viewer",
    event: "ShowReport",
    report: StiReport,

    preventDefault: boolean,
    async: boolean
}It is used to implement your own method of opening templates.
The event is triggered before the report file selection dialog box opens and before it is sent to the viewer. Below is a list of event handler arguments:
{
    sender: "Viewer",
    event: "OpenReport",
    report: StiReport,

    preventDefault: boolean,
    async: boolean
}viewerOptions.toolbar.showOpenButton = true;viewer.onOpenedReport = (args) => {
args.preventDefault = true;
args.async = true;
args.report = anotherReport;
callback();
}It is used to modify the report before transmitting it to the viewer.
The event is triggered after the report is opened but before it is sent to the viewer. Below is a list of event handler arguments:
{
    sender: "Viewer",
    event: "OpenedReport",
    report: StiReport,

    preventDefault: boolean,
    async: boolean
}viewerOptions.toolbar.showOpenButton = true;viewer.onOpenedReport = (args) => {
if (args.report.reportAuthor != "Stimulsoft") {
args.preventDefault = true;
window.alert("report.reportAuthor == " + args.report.reportAuthor);
}
}If you have any questions about the events in the report, please do not hesitate to contact us. In the next article, we will discuss report designer events.
Features of the engine in Stimulsoft products and their impact on speed
Wed, 10 Apr 2024 05:18:36 -0400
Today, we will discuss the features of the data processing engine in the Stimulsoft reporting tool and its impact on the speed of report generation.
- in the first version, all bands are located directly on the page;
- in the second version, the detail band is nested in master.
All properties of report components are configured to ensure that the output results in completely identical documents. The Northwind test database with a small amount of data is utilized. The output document comprises 137 pages with average information content. The comparison results indicate that the rendering speed of the first report is 15% higher. If you increase the number of nested bands or the amount of nested data, the difference in speed will be even more pronounced. Note!
Another feature of our data processing engine is that most properties whose names start with Keep (for example, KeepHeaderTogether and KeepFooterTogether) only work for bands that are located directly on the page.
Band-oriented report engine
The main and most frequently used component in the reporting process is the Section, or Band. The report engine is band-oriented. One of the main features of the engine is its optimization for working with bands located directly on the page. This is particularly relevant for reports with links. If the bands are nested within each other, the document rendering speed will be slower. The more nestings there are, the slower the report rendering can be. This becomes even more noticeable as the amount of embedded data increases.Sample report
We have prepared a simple Master-Detail report in two versions:- in the first version, all bands are located directly on the page;
- in the second version, the detail band is nested in master.
All properties of report components are configured to ensure that the output results in completely identical documents. The Northwind test database with a small amount of data is utilized. The output document comprises 137 pages with average information content. The comparison results indicate that the rendering speed of the first report is 15% higher. If you increase the number of nested bands or the amount of nested data, the difference in speed will be even more pronounced. Note!
Another feature of our data processing engine is that most properties whose names start with Keep (for example, KeepHeaderTogether and KeepFooterTogether) only work for bands that are located directly on the page.
Enabling caching from code
Fri, 29 Mar 2024 08:26:03 -0400

Today, we will address one of the most frequently asked questions by our users: how to enable report caching from code?
Accordingly, the code will look like this:
To reduce the size of the template file, only those properties whose values differ from the default value are written to it during saving. Before loading the template using the report.Load() method, most properties are automatically set to their default values. During the loading process, properties are then set to the values from the template.
Therefore, if a property is changed before the report is loaded, it will still be set to its default value before the report is loaded.
Typical mistake
The ReportCacheMode property is responsible for report caching, which users often enable before loading the report. For example:StiReport report = new StiReport();
report.ReportCacheMode = StiReportCacheMode.On;
report.Load(path);Solution
To enable report caching from code, you need to set the ReportCacheMode property to On not before, but AFTER loading the report.Accordingly, the code will look like this:
StiReport report = new StiReport();
report.Load(path);
report.ReportCacheMode = StiReportCacheMode.On;
Technical intricacies
Another frequently asked question: Why is the ReportCacheMode property not saved in the template, yet it is still set to Off after loading the report?To reduce the size of the template file, only those properties whose values differ from the default value are written to it during saving. Before loading the template using the report.Load() method, most properties are automatically set to their default values. During the loading process, properties are then set to the values from the template.
Therefore, if a property is changed before the report is loaded, it will still be set to its default value before the report is loaded.
Protecting Microsoft Office documents in Stimulsoft software
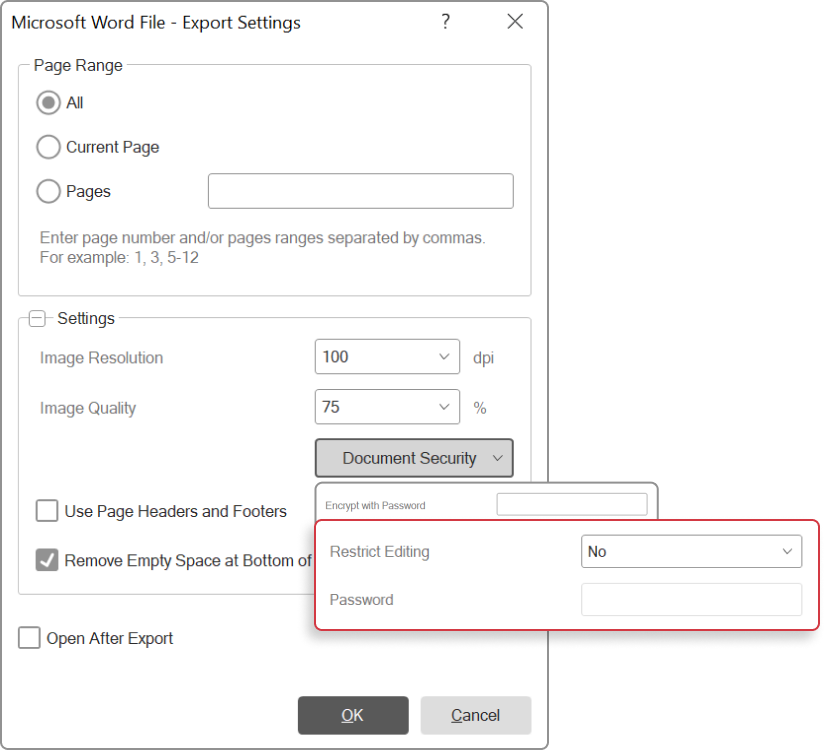
Beginning with version 2023.4, we have integrated the described functionality into our products. Now, when exporting reports to Microsoft Office documents, users can secure them against unauthorized access. Furthermore, for Word and Excel documents, it is now possible to restrict editing of page content. Further details on this enhancement will be discussed below. It is worth noting that previously, we only partially implemented editing protection, lacking the ability to set a password.
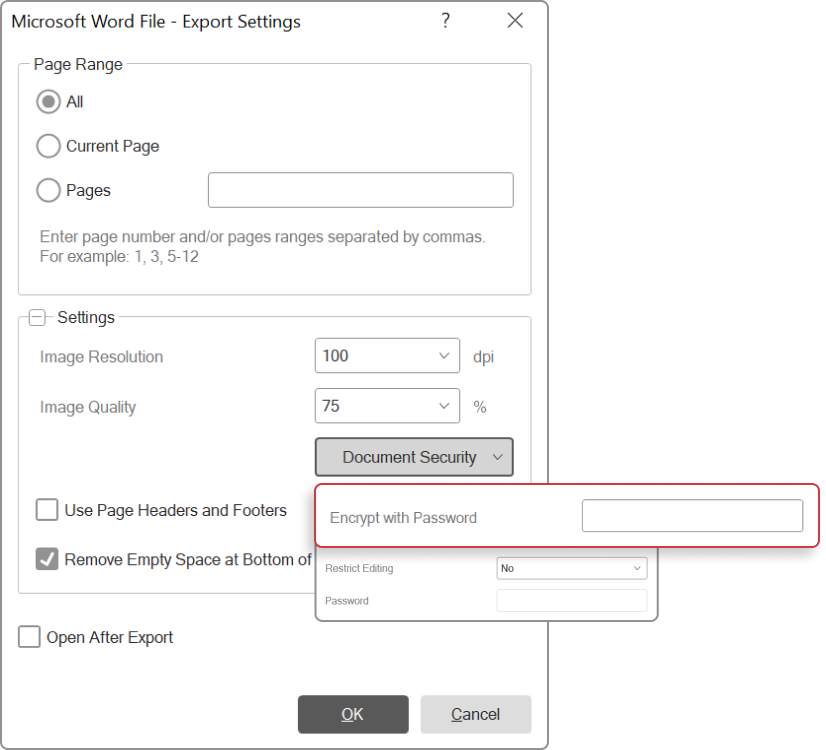
How to implement this in the viewer: In the export settings menu, locate the Document Security group and enter a password for the Encrypt with Password option.
When exporting a report from code, the password must be included in the export settings. For instance, when exporting to Word, it would look as follows:
Code used in our products BEFORE version 2024.2.1
How to implement this in the viewer: In the export settings menu, within the Document Security group, set the Restrict Editing parameter and also specify the password as the value of the Password parameter.
When exporting a report from code, the protection type and password must be configured in the export settings. For instance, exporting to Word would look like this:
Code used in our products BEFORE version 2024.2.1
Thu, 21 Mar 2024 07:26:31 -0400

Introduction
Microsoft Office documents offer multiple protection methods. For instance, users can restrict editing for the entire document or specific sections (depending on the document type), and also prevent unauthorized access to the document. These protection features can be combined, with each method requiring its own distinct password.Beginning with version 2023.4, we have integrated the described functionality into our products. Now, when exporting reports to Microsoft Office documents, users can secure them against unauthorized access. Furthermore, for Word and Excel documents, it is now possible to restrict editing of page content. Further details on this enhancement will be discussed below. It is worth noting that previously, we only partially implemented editing protection, lacking the ability to set a password.
Security measures for opening documents
Now, when exporting reports, you have the option to protect the document from unauthorized access. This feature is available for Word, Excel, and PowerPoint documents.How to implement this in the viewer: In the export settings menu, locate the Document Security group and enter a password for the Encrypt with Password option.
When exporting a report from code, the password must be included in the export settings. For instance, when exporting to Word, it would look as follows:
Code used in our products BEFORE version 2024.2.1
var settings = new StiWord2007ExportSettings();
settings.EncryptionPassword = "123456";
report.ExportDocument(StiExportFormat.Word2007, "Report.docx", settings);var settings = new StiWordExportSettings();
settings.EncryptionPassword = "123456";
report.ExportDocument(StiExportFormat.Word, "Report.docx", settings);Document editing security
The functionality for protecting documents from being edited (applicable to Word and Excel documents) has been enhanced. As before, you can select the type of editing protection by using the Restrict Editing parameter. Now, you can also set a password for this protection, allowing document editing in Word and Excel only after the correct password is entered.How to implement this in the viewer: In the export settings menu, within the Document Security group, set the Restrict Editing parameter and also specify the password as the value of the Password parameter.
When exporting a report from code, the protection type and password must be configured in the export settings. For instance, exporting to Word would look like this:
Code used in our products BEFORE version 2024.2.1
var settings = new StiWord2007ExportSettings();
settings.RestrictEditing = StiWord2007RestrictEditing.ExceptEditableFields;
settings.ProtectionPassword = "123456";
report.ExportDocument(StiExportFormat.Word2007, "Report.docx", settings);var settings = new StiWordExportSettings();
settings.RestrictEditing = StiWordRestrictEditing.ExceptEditableFields;
settings.ProtectionPassword = "123456";
report.ExportDocument(StiExportFormat.Word, "Report.docx", settings);
Some changes when creating Master-Detail reports
Fri, 15 Mar 2024 07:02:13 -0400

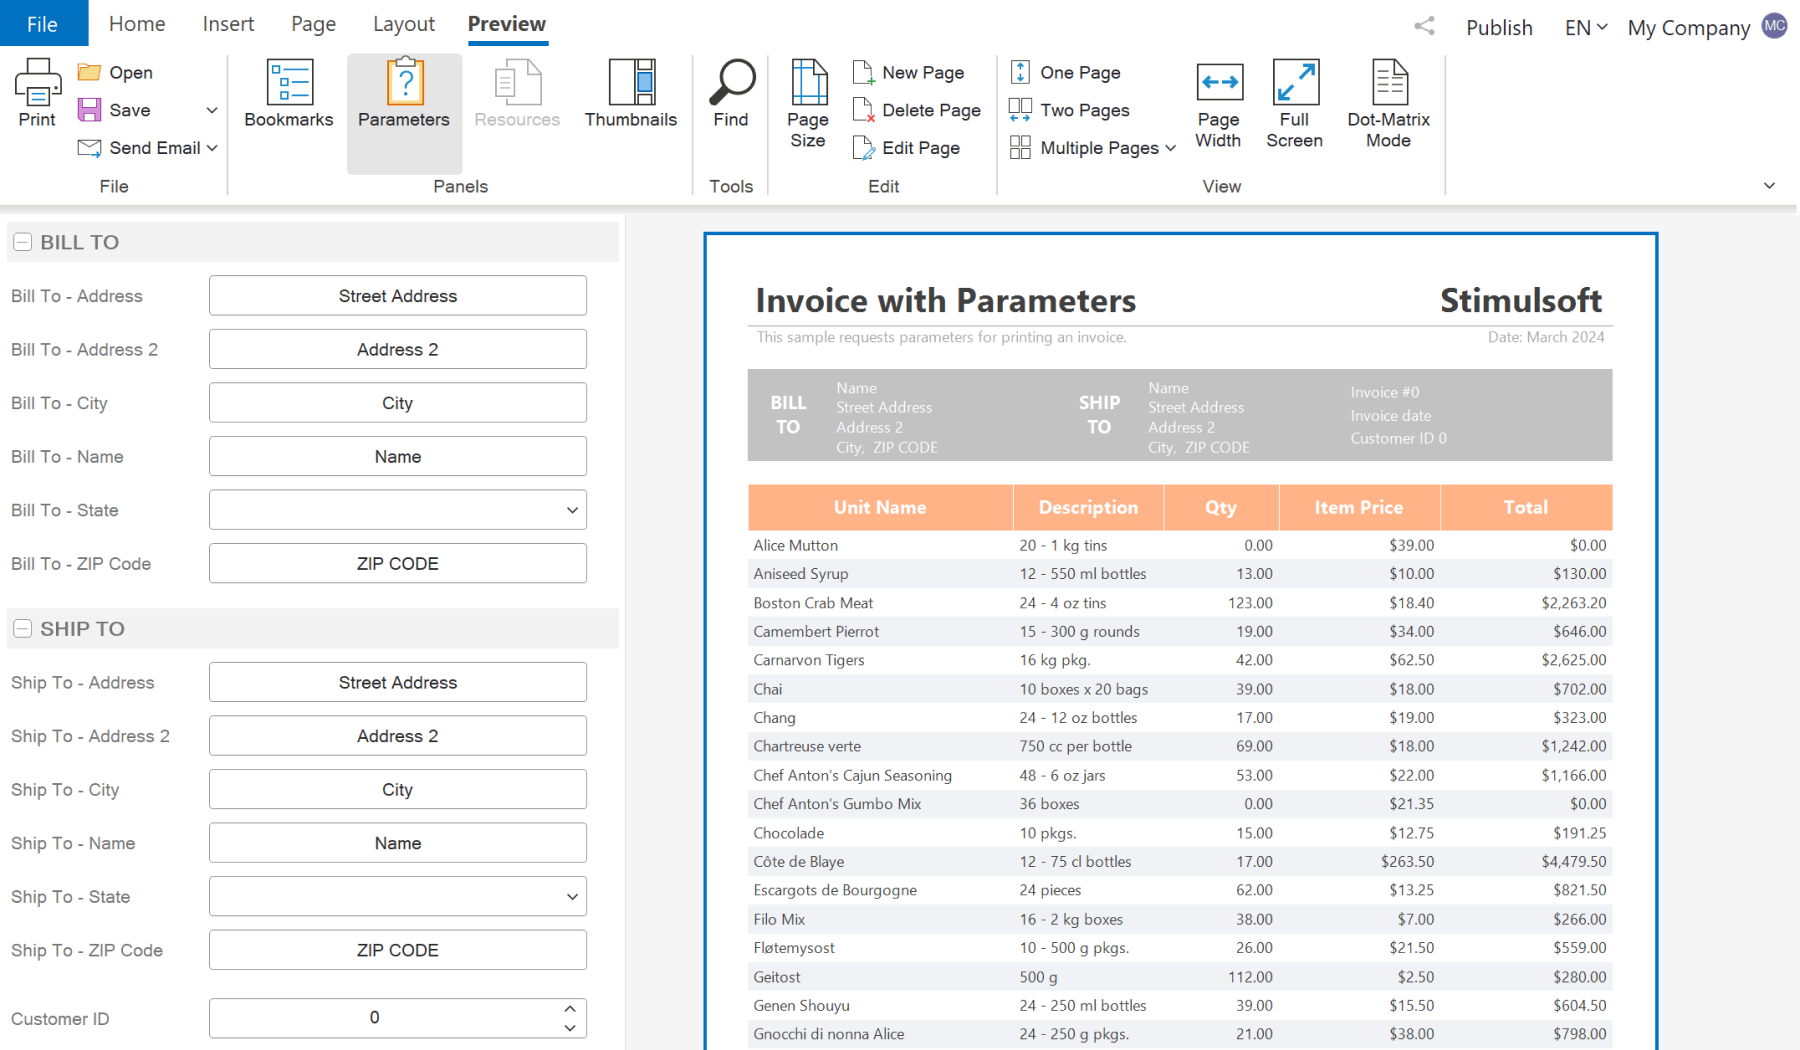
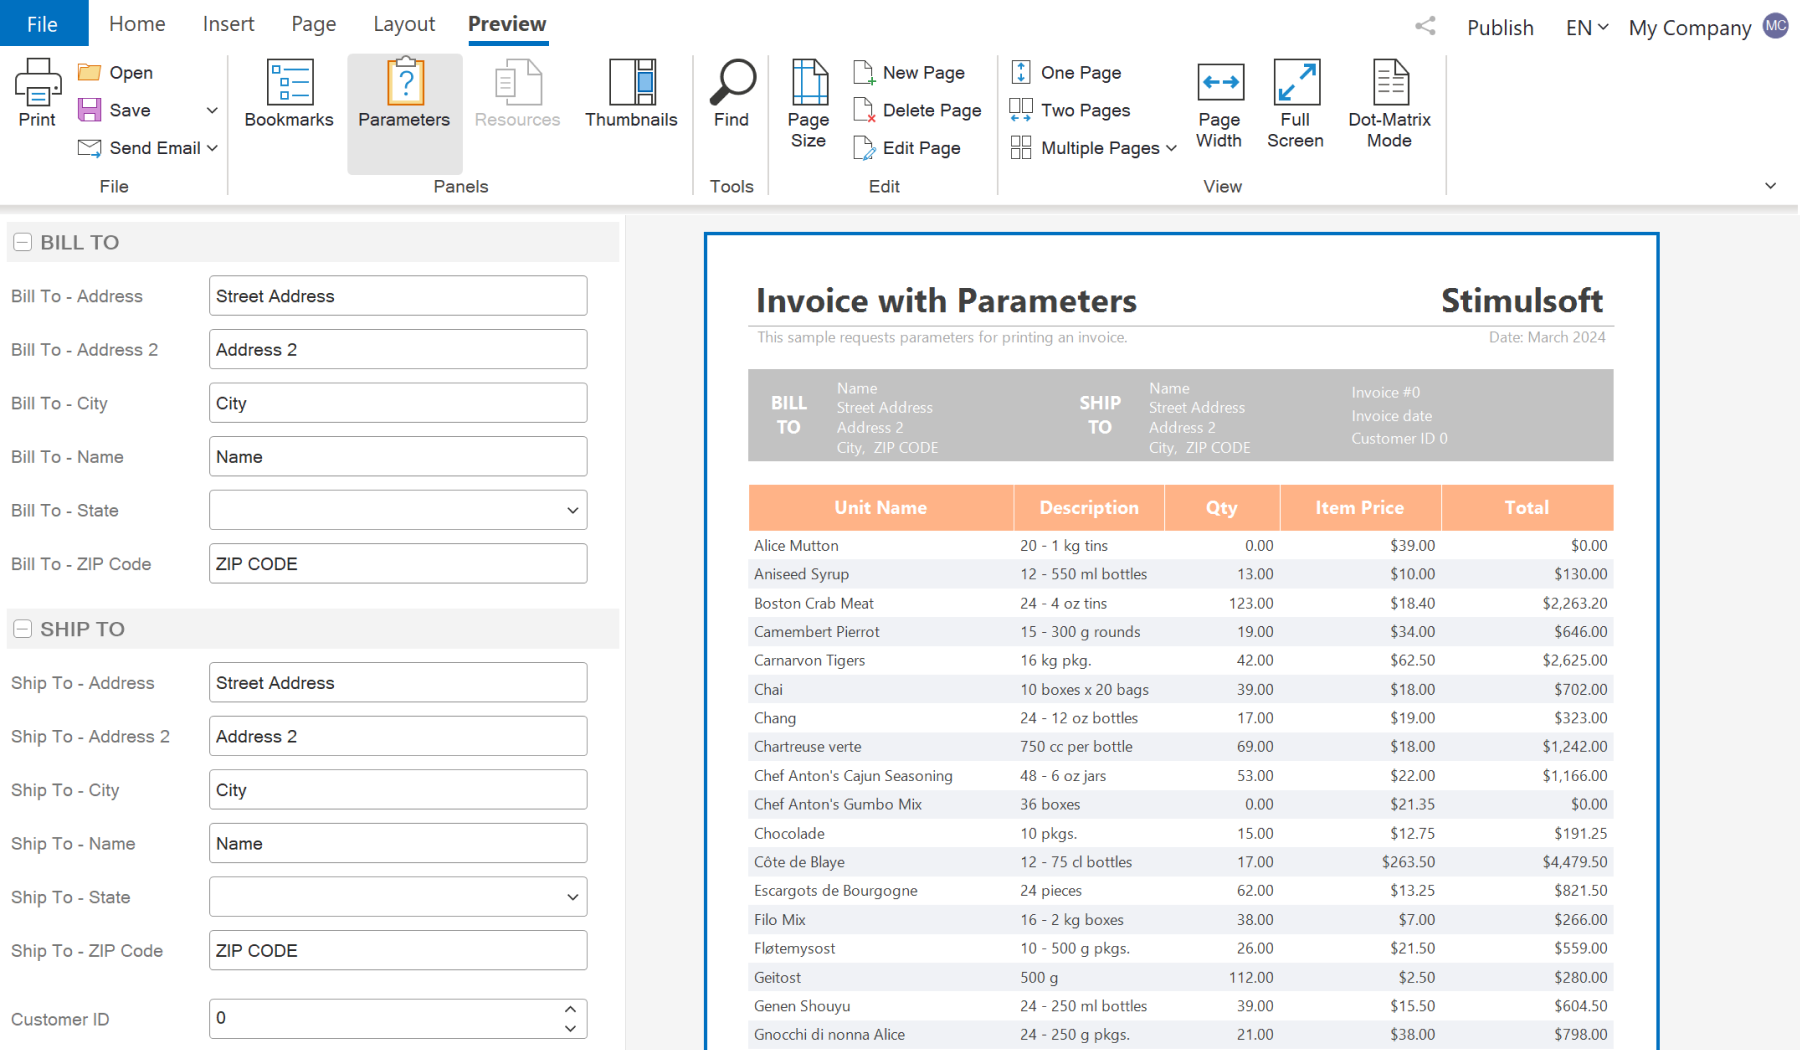
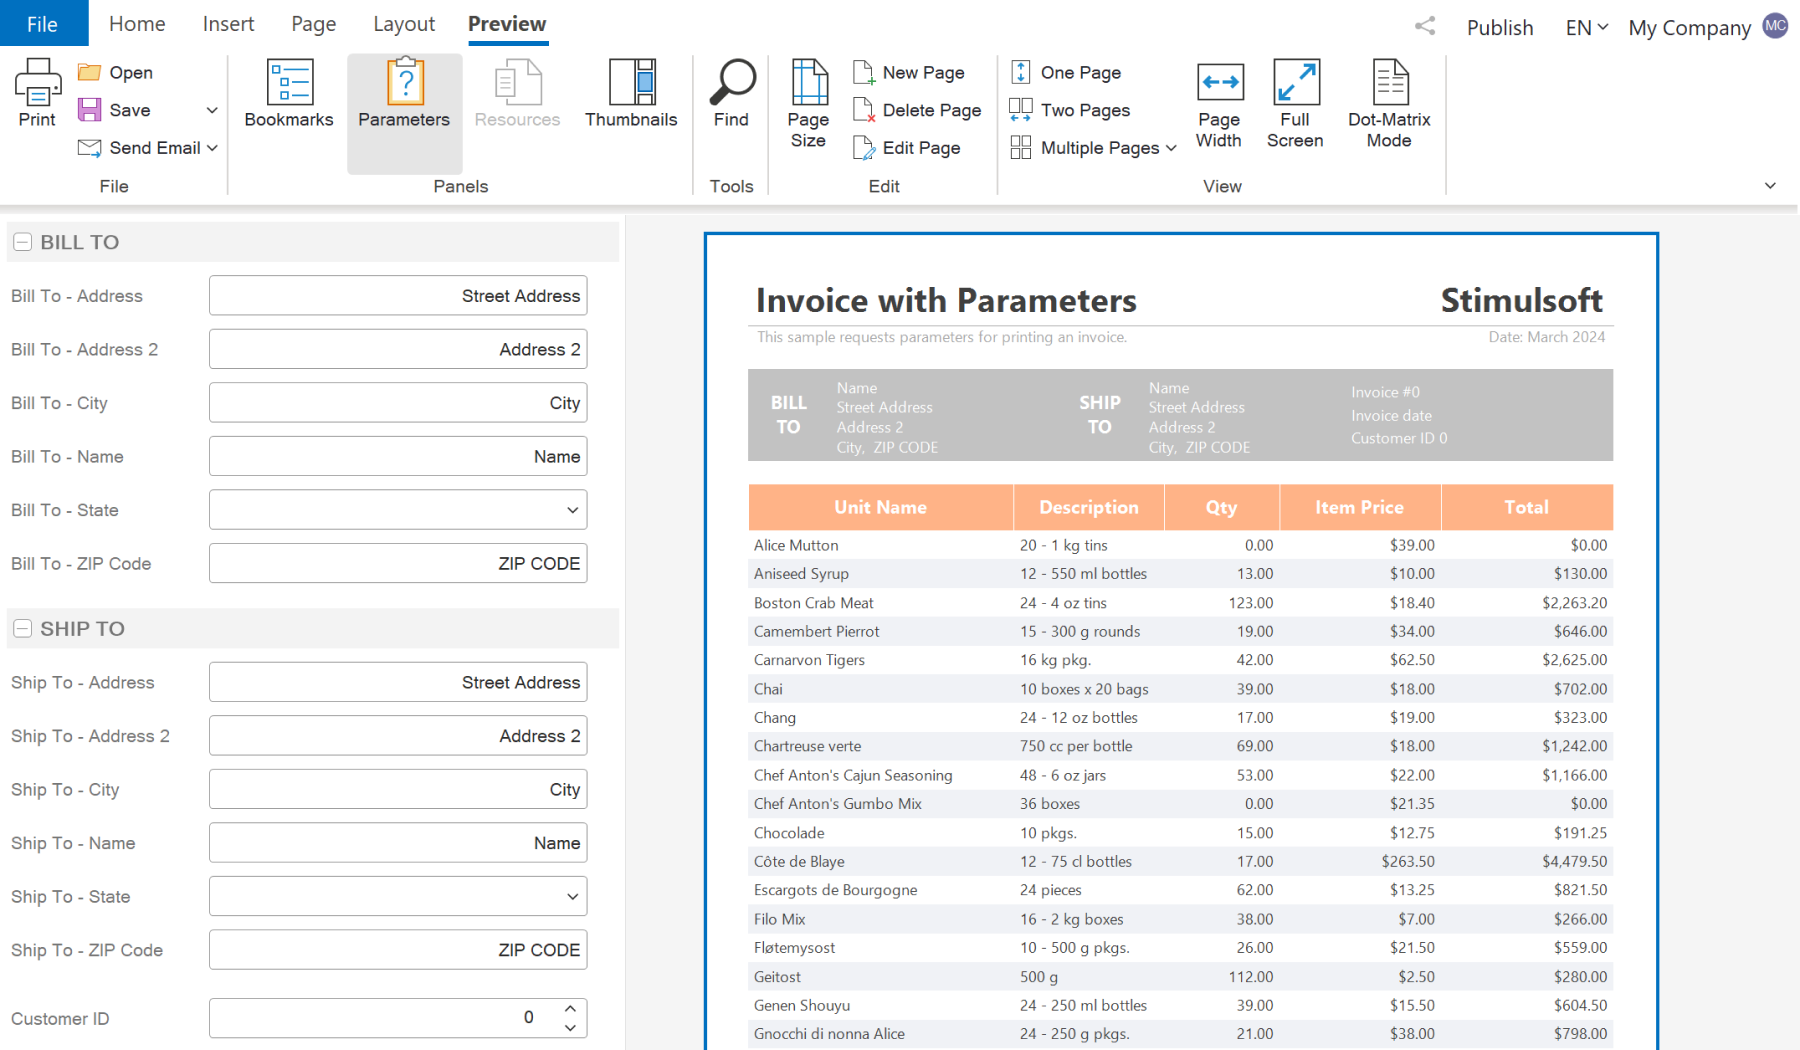
In today's article, we will discuss an important change regarding the principle of creating Master-Detail reports in Stimulsoft products.
In the viewer above, we see a standard example: information about each product category is displayed first, followed by a list of products belonging to that category.
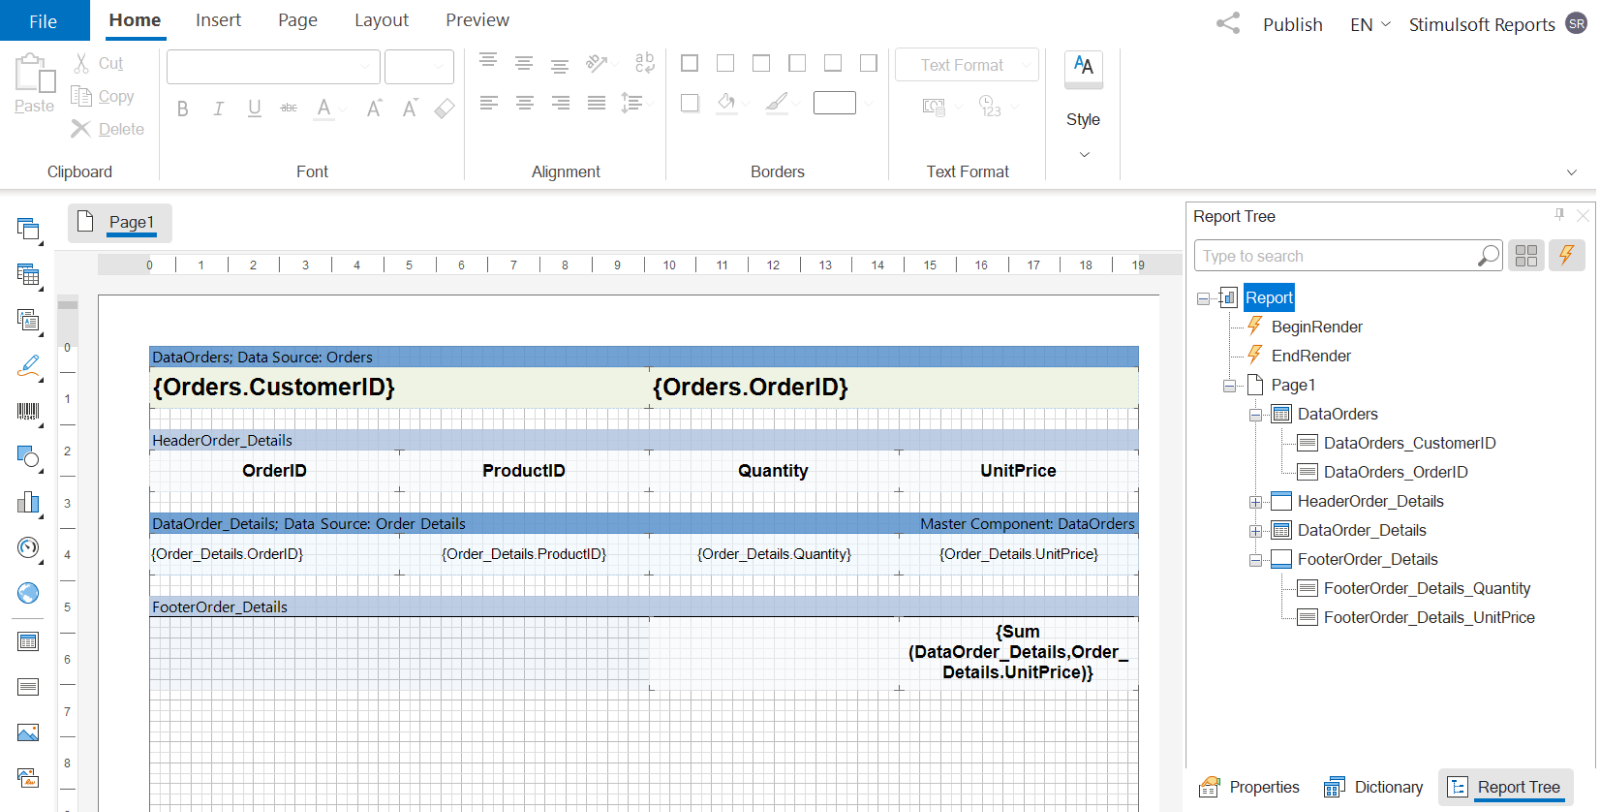
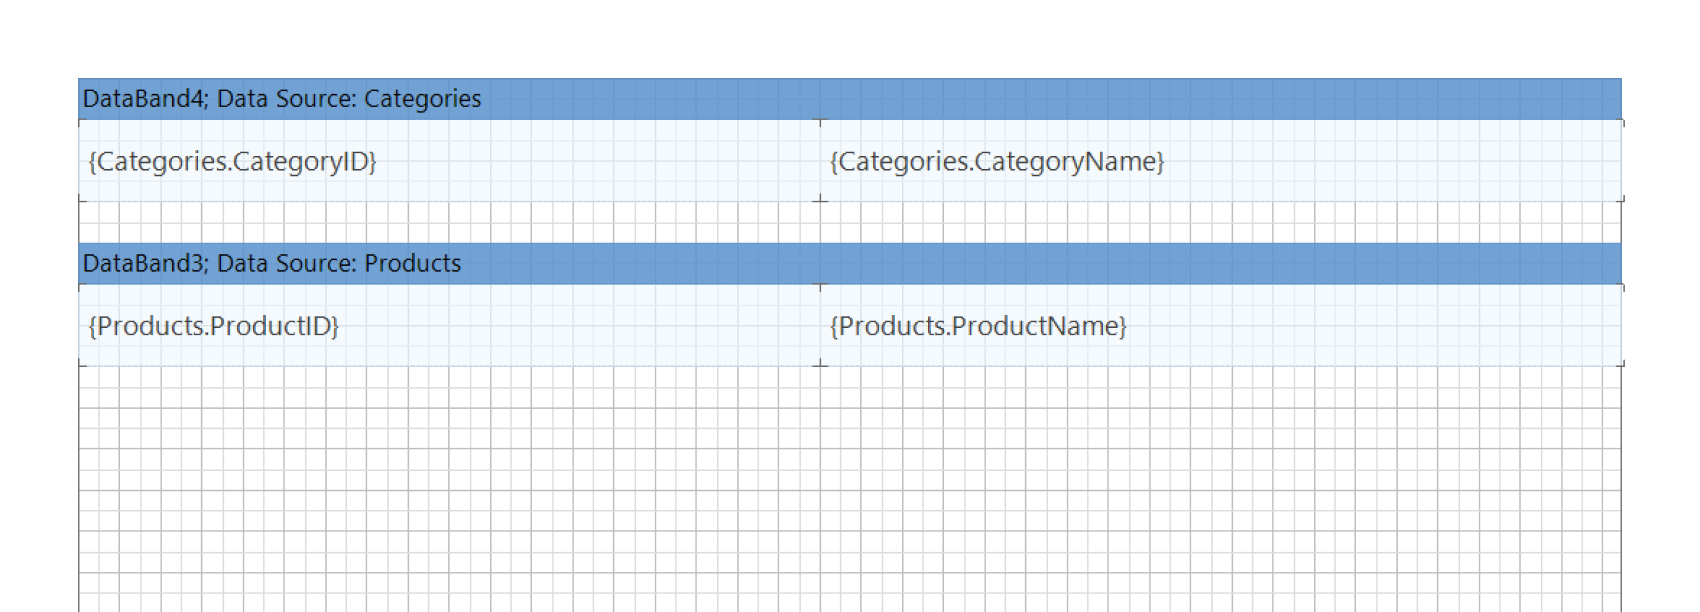
The first way is to place the Detail band after the Master band:
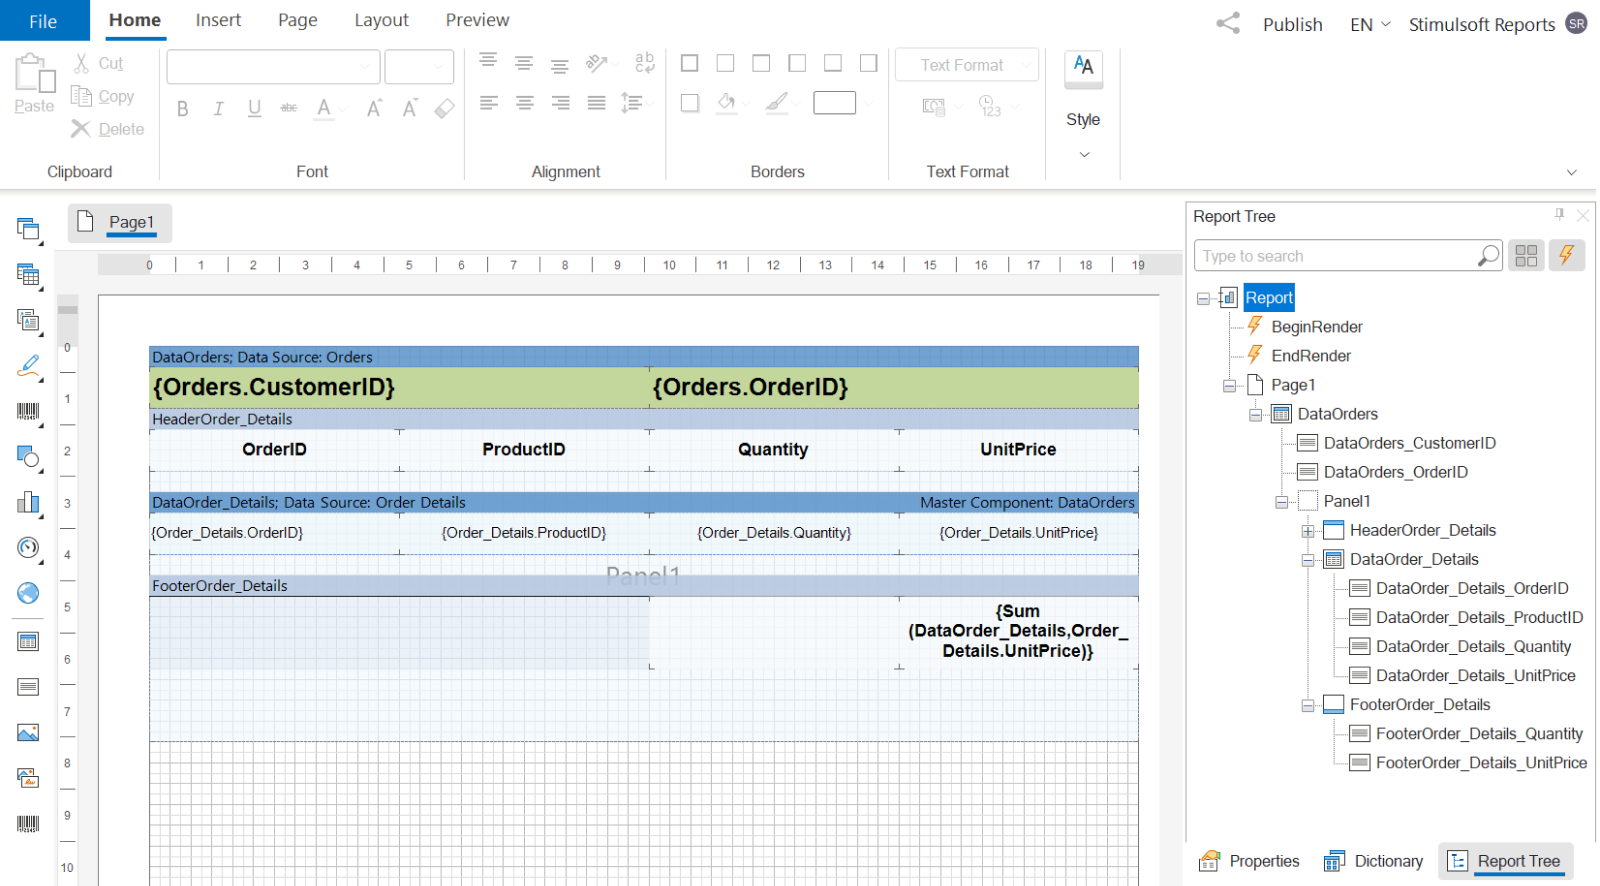
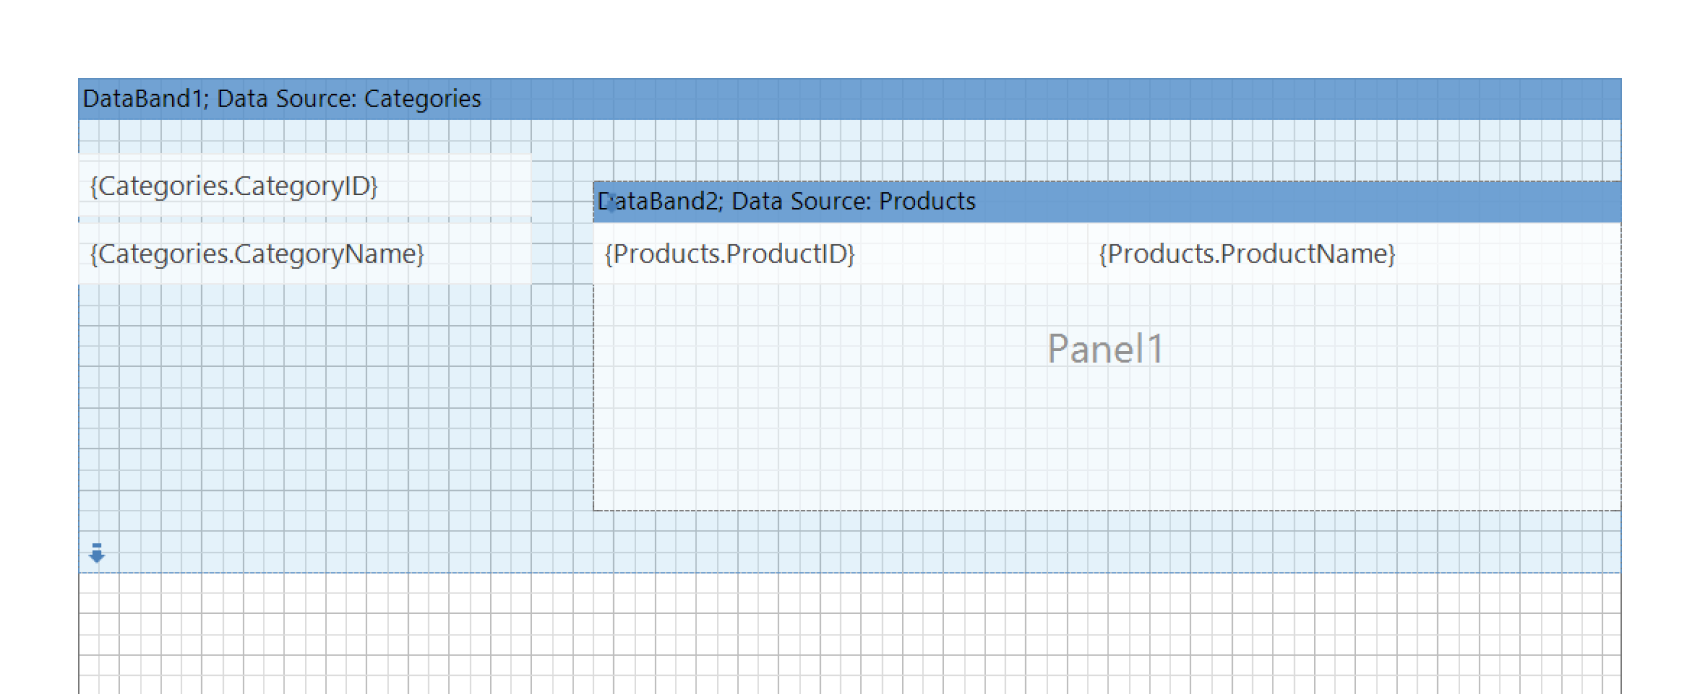
The second way is to place the Detail band within the Master band; in this case, we will refer to it as a nested Detail band.
 Note!
Note!
The Panel component is used as a container for other elements. You can place one or more elements on one panel. Only Cross bands can be placed directly on other bands; other bands can only be placed in containers. The two ways for placing bands described above function in the same way. The choice of option depends solely on the appearance of the report you wish to achieve. In practice, the second option is usually chosen when there is a small amount of data for a detail section.
In practice, there is often no need to display empty categories. Therefore, by default, our engine hides them. However, users can choose whether to display empty categories or not. They can use the master band property Print if Detail Empty to do this. If the value of this property is set to true, then all records of the master band will be printed regardless of whether there is Detail data for them.
Previously, nested detail bands were displayed in any case, regardless of the value of the PrintIfDetailEmpty property of the master band. Therefore, if the property is already set to true for the master band, then nothing will change; the detail band will be displayed as before. Technically, nested bands have always been considered detail bands, regardless of whether they have the MasterComponent property set. However, since the PrintIfDetailEmpty property had no effect on them before, users were unaware of it.
Thus, this modification may affect some reports with nested bands that were not originally created as Master-Detail reports. If the nested band does not have data, then the main band will not be displayed either.
If the problem affects a large number of your reports, or you do not have the time to change your reports, you can use the second option. However, it affects all reports. If, in a report, you need to remove the Master band, and it has no detailization, you will still have to use the first option, that will require changes in each report.
Please also note that some properties from StiOptions are introduced only to ensure backward compatibility with older versions. Someday, during the next major refactoring, these properties may be marked as Obsolete and removed a few years later.
What is a Master-Detail report?
Master-Detail is a type of report in which data is interconnected and organized into several levels: one Master band data record corresponds to several Detail data band records. In other words, the Master-Detail report is a data with detailization, for instance, a report where data is displayed by categories:In the viewer above, we see a standard example: information about each product category is displayed first, followed by a list of products belonging to that category.
Master-Detail report structure
Our product offers two ways for the relative position of bands in the Master-Detail report.The first way is to place the Detail band after the Master band:
The second way is to place the Detail band within the Master band; in this case, we will refer to it as a nested Detail band.
Note!The Panel component is used as a container for other elements. You can place one or more elements on one panel. Only Cross bands can be placed directly on other bands; other bands can only be placed in containers. The two ways for placing bands described above function in the same way. The choice of option depends solely on the appearance of the report you wish to achieve. In practice, the second option is usually chosen when there is a small amount of data for a detail section.
Features of building Master-Detail reports
The report sample at the beginning of the article demonstrates the so-called “ideal situation” in which all categories contain product data. However, in real data, some categories may not contain any products. Consequently, there may be nothing to display in the category details.In practice, there is often no need to display empty categories. Therefore, by default, our engine hides them. However, users can choose whether to display empty categories or not. They can use the master band property Print if Detail Empty to do this. If the value of this property is set to true, then all records of the master band will be printed regardless of whether there is Detail data for them.
Changes in the operation of the PrintIfDetailEmpty property
Let's proceed to the main topic of the article. Beginning from version 2023.2, the logic of the PrintIfDetailEmpty property has been enhanced. Previously, the property only functioned with Detail bands located after the Master band. Now, the property also operates for Detail bands located within the Master band. Note!Previously, nested detail bands were displayed in any case, regardless of the value of the PrintIfDetailEmpty property of the master band. Therefore, if the property is already set to true for the master band, then nothing will change; the detail band will be displayed as before. Technically, nested bands have always been considered detail bands, regardless of whether they have the MasterComponent property set. However, since the PrintIfDetailEmpty property had no effect on them before, users were unaware of it.
Thus, this modification may affect some reports with nested bands that were not originally created as Master-Detail reports. If the nested band does not have data, then the main band will not be displayed either.
Solution
If the problem described above occurs in your report, you can solve it in one of the following ways:- Set the value of the PrintIfDetailEmpty property to true for a band that contains other nested bands;
- Set the value of the static property from the application code.
StiOptions.Engine.CheckForEmptyNestedDetail=false
If the problem affects a large number of your reports, or you do not have the time to change your reports, you can use the second option. However, it affects all reports. If, in a report, you need to remove the Master band, and it has no detailization, you will still have to use the first option, that will require changes in each report.
Please also note that some properties from StiOptions are introduced only to ensure backward compatibility with older versions. Someday, during the next major refactoring, these properties may be marked as Obsolete and removed a few years later.
A new version of Stimulsoft Reports, Dashboards, and Forms 2024.2 has been released!
Tue, 05 Mar 2024 08:02:52 -0500

We are excited to announce the release of the latest version of Stimulsoft products for creating reports, dashboards, and forms - 2024.2! In this update, you will find products for Python applications and services, a new dashboard element, compatibility of our components with .NET 8.0, enhanced functionality for interactivity in dashboards, and much more.


A list of the new features in version 2024.2
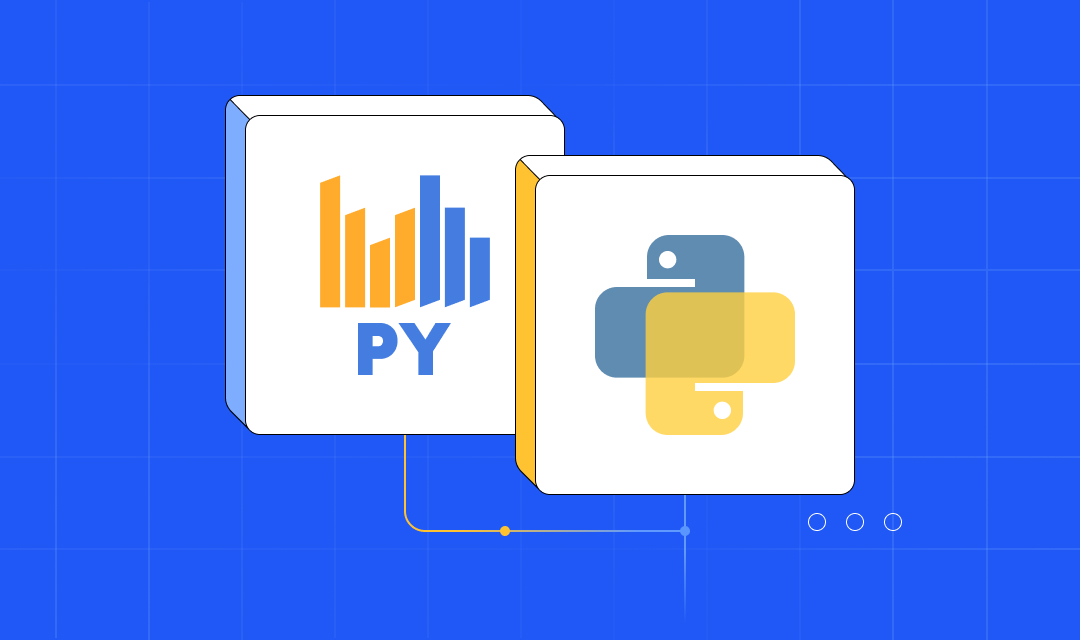
Reporting tool for Python
We are pleased to introduce a new product - Stimulsoft Reports.PYTHON! This is a set of libraries that you may use for creating, viewing, exporting, and printing reports in applications and projects written in Python. The product is based on client-server technology: a Python application on the server side and a JavaScript reporting engine on the client side.Dashboards for Python
We are also pleased to announce the launch of Stimulsoft Dashboards.PYTHON - a product for data visualization in the context of creating analytical panels in Python applications and services. The product consists of a JavaScript data processing engine, a designer for creating dashboards, and a viewer for viewing them. These components are closely related to each other and represent full-fledged tools for working with dashboards in web applications built with Python.The New Element - Web Content
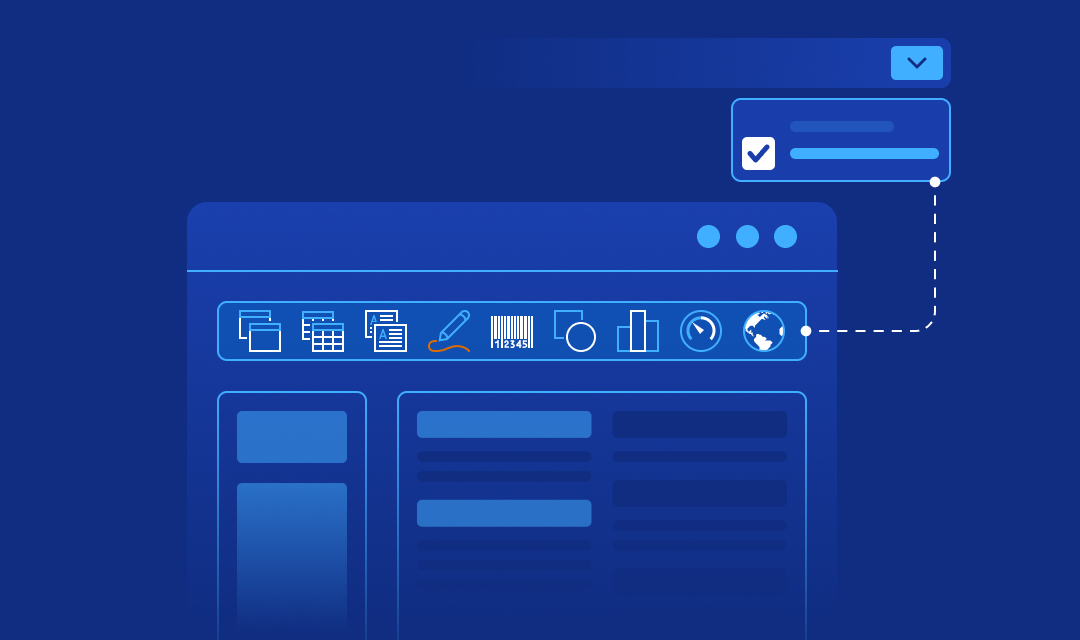
In this release, we have added a new dashboard element - Web Content. You can use it to display any content via a link or an embed code. This functionality allows you to add videos, website pages, and other embed codes to dashboards.Components for .NET 8
Another important update! Starting with version 2024.2.1, .NET 8 support has been added for our components. Our libraries will now be compiled using the .NET 8.0 SDK. We closely monitor the development of .NET and strive to ensure that our components are compatible with the latest technologies as closely as possible.Parameters in element filters
We have included the capability to transmit parameters while applying filters (the Apply Filter action) in dashboard elements. These parameters can hold filter values. So, when accessing a parameter by its name in a report variable or another dashboard element, it will be possible to retrieve the value of the element's filters.Interaction for dashboard elements
Support for interaction has been added for the List Box, Combo Box, and Shape dashboard elements. Now, you can display a hover tooltip on hovering. However, the click action varies. Clicking on the values in the filtering elements allows you to apply a filter and pass parameters. For Shapes, you can open a hyperlink or another dashboard. The interaction is configured in the same way as for other dashboard elements, within the Interaction editor of the element.Settings for labels in charts
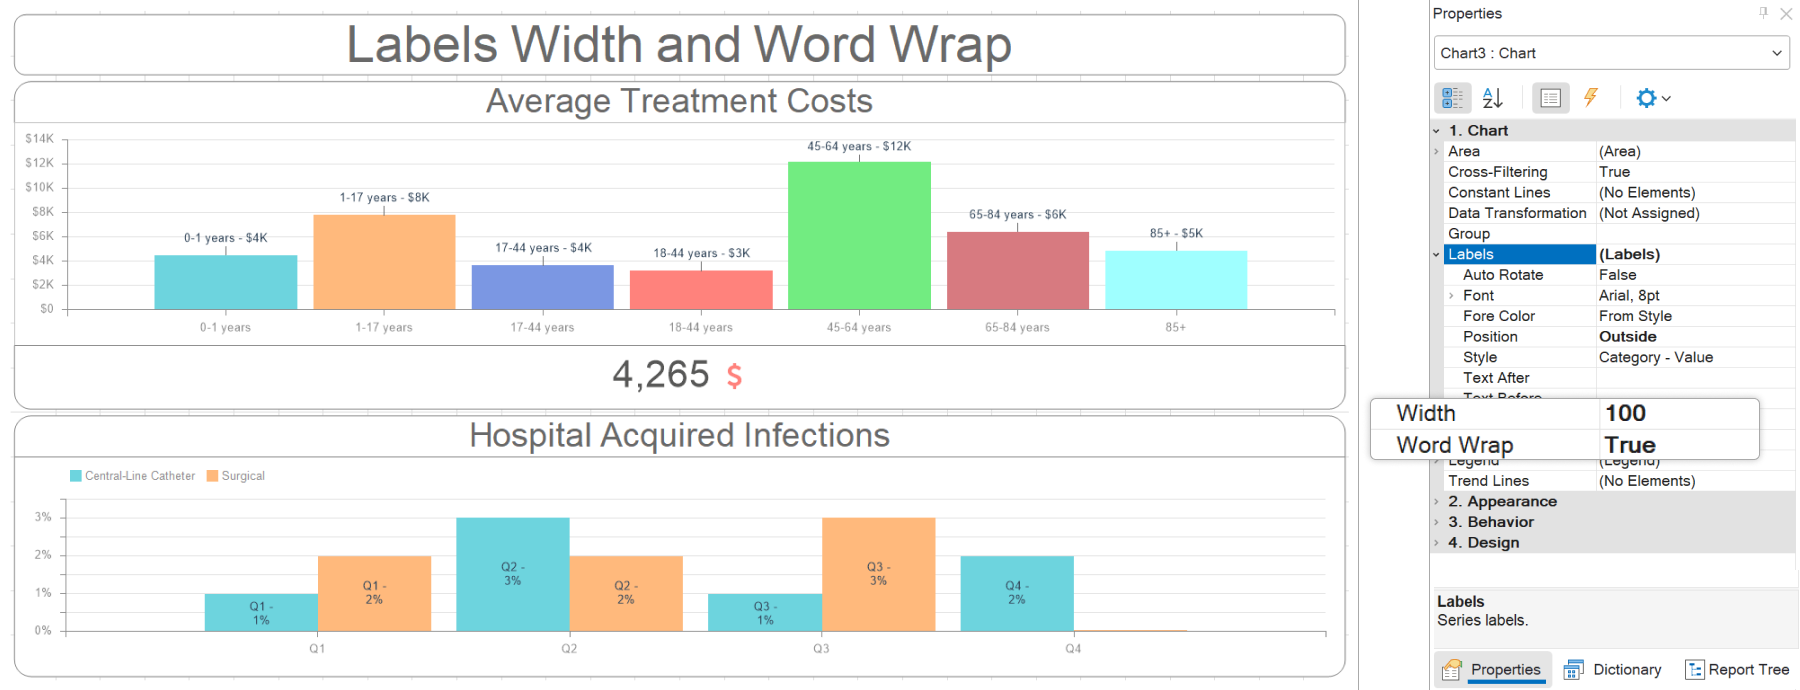
In this release, we have added the ability to set the width in pixels for labels in dashboard charts. This can be accomplished using the Width property in the Labels group. By default, the property is set to 0, which means that the width of the labels is calculated automatically. Additionally, we have introduced the ability to enable line wrap mode for labels by setting the Word Wrap property from the Labels group to True.
Reset all filters in events
We have introduced the ability to reset all filters when an event occurs in dashboards. If you create an event script using Blockly, you can reset all filters using a separate process called Reset All Filters. If you write an event script using code, a special method has been added. In C#, this method is InvokeResetAllFilters(), and in JavaScript, it is invokeResetAllFilters().New functions
New functions for checking data for a report or dashboard have been added to the Data category. You can use the IsNumeric() function to check whether a value is numeric. The IsDataEmpty() function checks whether a data source contains at least one row of data. When using the IsAllDataRowNullOrEmpty() function, you can check whether all rows in a data column are empty or null. Also, the IsNullOrEmpty() and IsNullOrWhiteSpace() functions have been added, which are used to check whether a value is null, empty, or a whitespace.Aligning values in parameters
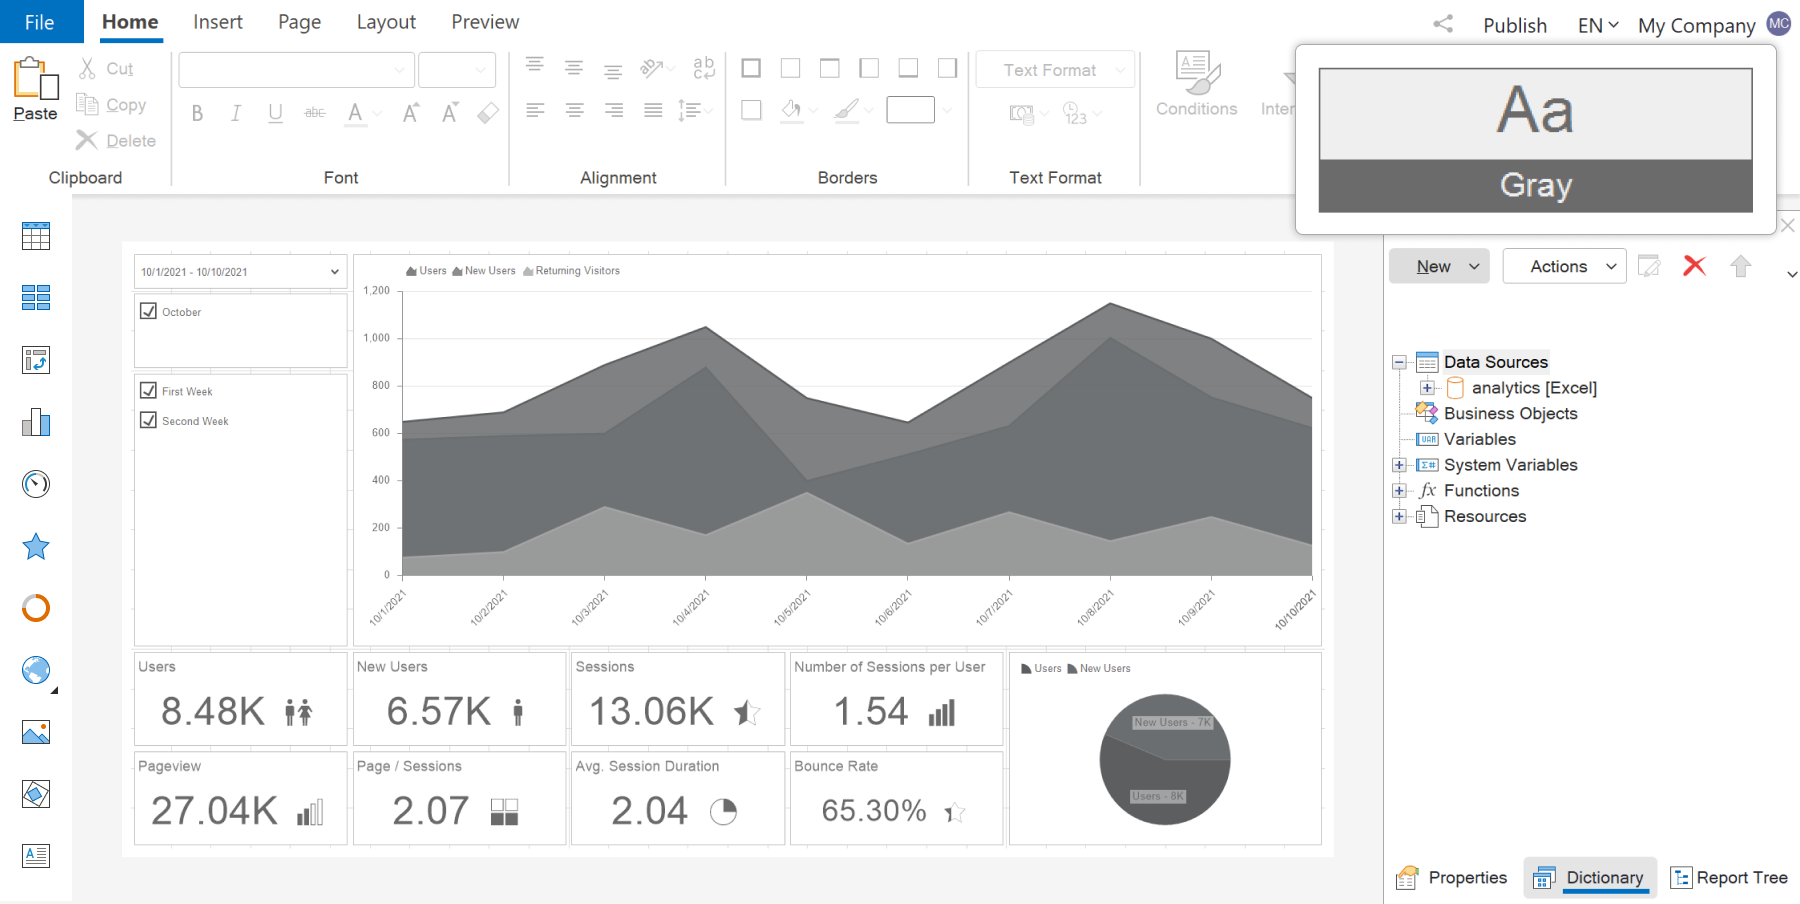
In version 2024.2.1, you can change the alignment of values in parameters when viewing reports and dashboards. By default, all parameter values are left-aligned. However, using the Parameter Alignment property, you can set the location of values in the parameter field to Left, Center, or Right.The new style
We have added a new design style for the dashboard and its elements - Gray, as well as a new preset style for report components - Style36. To apply the new style, select the dashboard and choose the Gray theme from the Style menu.
Events in the reporting tool for JavaScript applications. Part 1. Report Events.
Wed, 28 Feb 2024 04:03:32 -0500
We are commencing a series of articles dedicated to events in the JavaScript reporting tool. When developing JS projects, various events arise for objects such as a report, as well as visual components like the designer and the viewer. In this article, we will discuss report object events.
onPrepareVariables
Report variables can be utilized both within the report and in queries to the data storage. You can populate variables or modify their values using the onPrepareVariables event.
This event is invoked at the outset of the report render, before populating the variables. Below is a list of event handler arguments:
onBeginProcessData
A situation often arises where the connection to the data storage needs to be replaced before rendering a report. This can be easily accomplished using the onBeginProcessData event.
This event is invoked before requesting the data necessary to construct the report and enables you to modify the connection parameters accordingly. Below is a list of event handler arguments:
onEndProcessData
There are also situations when, after retrieving data, it needs to be adjusted or transformed. For example, creating custom datasets. This is easy to do using the onEndProcessData event.
This event is raised after the data has been received, but before the report-building process begins. List of event handler arguments:
onBeginRender
The event is called at the beginning of building a report template. For example, you can replace a value in a component before processing it:
onRendering
The event is called during the creation of a report template, that is, when creating each new page of the template.
Below is the code for changing numeric values in text components:
onEndRender
The event is raised at the end of the report template processing.
For example, after rendering a report, you can export it:
onExporting
This event is called before the report is exported. For example, you can display a message indicating that the report is ready for export:
onExported
This event is called after the report is exported. For example, after finishing exporting a report, you can display a message indicating the completion of this process:
onPrinting
The report may be sent for printing, in which case it can be modified using this event.
This event occurs when either report.print() or report.printToPdf() is called, allowing the report to be modified before printing.
For instance, you can remove an image from a report before printing.
onPrinted
Another event occurs when printing a report, allowing you to modify a report that has already been converted into an HTML or PDF document, or implement your own printing method.
This event is raised when calling report.print() or report.printToPdf() after exporting to PDF or HTML, depending on the method called. Note!
The onPrinted event occurs after the report is exported, while the onPrinting event occurs after the print method is called, even before it is converted. Below is a list of event handler arguments:
onRefreshing
If you need to make any changes when updating a report or dashboard, you can easily do so using the onRefreshing event.
This event occurs when you click the Refresh button in the viewer or when automatically refreshing using the report.refreshTime property.
Reports events
Report variables can be utilized both within the report and in queries to the data storage. You can populate variables or modify their values using the onPrepareVariables event.
This event is invoked at the outset of the report render, before populating the variables. Below is a list of event handler arguments:
{
	event: "PrepareVariables",
	sender: "Report",
	report: StiReport,

	preventDefault: boolean,
	async: boolean,

	variables: []
}report.onPrepareVariables = (args, callback) => {
args.variables[0].value = "Replace value";
}A situation often arises where the connection to the data storage needs to be replaced before rendering a report. This can be easily accomplished using the onBeginProcessData event.
This event is invoked before requesting the data necessary to construct the report and enables you to modify the connection parameters accordingly. Below is a list of event handler arguments:
{
	sender: "Report",
	event: "BeginProcessData",
	report: StiReport,

	preventDefault: boolean,
	async: boolean,

	command: string,
	database: string,
	connection: string,

	headers: [],
	withCredentials: string,

	// Json
	pathData: string,
	tryParseDateTime: boolean,
	relationDirection: StiRelationDirection,

	// Xsd
	pathSchema: string,

	// Xml
	pathData: string,
	tryParseDateTime: boolean,
	relationDirection: StiRelationDirection,

	// Excel
	pathData: string,
	firstRowIsHeader: boolean,

	// OData
	connectionString: string,
	dataSource: string,
	collectionName: string,

	// Sql
	connectionString: string,
	dataSource: string,
	queryString: string,
	timeout: number,
	parameters: { name: string, value: string | number }[],
	escapeQueryParameters: boolean,

	// Gis
	pathData: string,
	separator: string,
	dataType: StiGisDataType,

	// Csv
	pathData: string,
	separator: string,
	codePage: number,

	// DBase
	pathData: string,
	codePage: number
}report.onBeginProcessData = (args) => {
if (args.database == "MySQL")
args.connectionString = "new connection string";
}report.onBeginProcessData = (args, callback) => {
if (args.database == "MySQL"){
args.preventDefault = true;
var result = {
success: true,
rows: [
["value1", 1, false],
["value2", 1, true],
["value3", 2, false]
],
columns: [
"Column1_name",
"Column2_name",
"Column3_name"
],
types:[
"string",
"int",
"boolean"
]
}
// https://github.com/stimulsoft/DataAdapters.JS/
callback(result);
}
}There are also situations when, after retrieving data, it needs to be adjusted or transformed. For example, creating custom datasets. This is easy to do using the onEndProcessData event.
This event is raised after the data has been received, but before the report-building process begins. List of event handler arguments:
{
    sender: "Report",
    event: "EndProcessData",
    report: StiReport,

    command: string,
    dataSource: string,
    connection: string,
    database: sgtring,

    result: DataSet|any
}
report.onEndProcessData = (args) => {
    if (args.command == "ExecuteQuery" && args.dataSource == "Categories")
        args.result.rows.push(rowData) ;

    // https://github.com/stimulsoft/DataAdapters.JS/
}
The event is called at the beginning of building a report template. For example, you can replace a value in a component before processing it:
report.onBeginRender = function (args) {
    const text = this.pages.getByIndex(0).components.getByIndex(0);
    const newValue = report.dictionary.variables.getByName("Variable2").value;
    text.text = newValue;
}The event is called during the creation of a report template, that is, when creating each new page of the template.
Below is the code for changing numeric values in text components:
report.onRendering = function (args) {
	const components = this.pages.getByIndex(0).components.list;

	for (let component of components) {
		if (component instanceof Stimulsoft.Report.Components.StiText) {
			const num = Number.parseFloat(component.text);
			if (!isNaN(num)) {
				component.text = String(num * 100);
			} else {
				console.log("The value is NaN");
			}
		}
	}
}The event is raised at the end of the report template processing.
For example, after rendering a report, you can export it:
report.onEndRender = (args) => {
	report.exportDocumentAsync(function (data) {
		Stimulsoft.System.StiObject.saveAs(data, "Report.pdf", "application/pdf");
	}, Stimulsoft.Report.StiExportFormat.Pdf);
}This event is called before the report is exported. For example, you can display a message indicating that the report is ready for export:
report.onExporting = (args) => {
	console.log("The report is complected for exporting to ${args.exportFormat");
}This event is called after the report is exported. For example, after finishing exporting a report, you can display a message indicating the completion of this process:
report.onExported = (args) => {
    const pages = report.renderedPages.list;
    console.log("PDF file contains " + pages.length + " pages");
}The report may be sent for printing, in which case it can be modified using this event.
This event occurs when either report.print() or report.printToPdf() is called, allowing the report to be modified before printing.
For instance, you can remove an image from a report before printing.
report.onExported = (args) => {
    const pages = report.renderedPages.list;
    console.log("PDF file contains " + pages.length + " pages");
}Another event occurs when printing a report, allowing you to modify a report that has already been converted into an HTML or PDF document, or implement your own printing method.
This event is raised when calling report.print() or report.printToPdf() after exporting to PDF or HTML, depending on the method called. Note!
The onPrinted event occurs after the report is exported, while the onPrinting event occurs after the print method is called, even before it is converted. Below is a list of event handler arguments:
{
	sender: "Report",
	event: "PrintReport",
	report: StiReport,

	preventDefault: boolean,
	async: boolean,

	data: string | number[]
}report.onPrintReport = (args) => {
args.preventDefault = true;
var printData = args.data;
myPrintingMethod(printData);
}If you need to make any changes when updating a report or dashboard, you can easily do so using the onRefreshing event.
This event occurs when you click the Refresh button in the viewer or when automatically refreshing using the report.refreshTime property.
If you have any questions about the events in the report, please feel free to contact us. In the next article, we will discuss report designer events.
Updating framework versions required to work with Stimulsoft software
For our products Stimulsoft Reports.AVALONIA, Stimulsoft Reports.BLAZOR and Stimulsoft Dashboards.BLAZOR, compilation for the following frameworks will be supported:
All other framework versions are also fully compatible with our products, and when utilizing libraries, their minimum required version will be loaded.
All our components undergo thorough testing and are fully compatible with all specified framework versions, including their minor updates and newer versions.
Tue, 20 Feb 2024 11:01:41 -0500
We are announcing a significant update to the versions of the various frameworks utilized for compilation of our products. All changes outlined in this note will be incorporated into version 2024.2 of Stimulsoft Reports, Dashboards, and Forms.
.NET 5.0 and Blazor
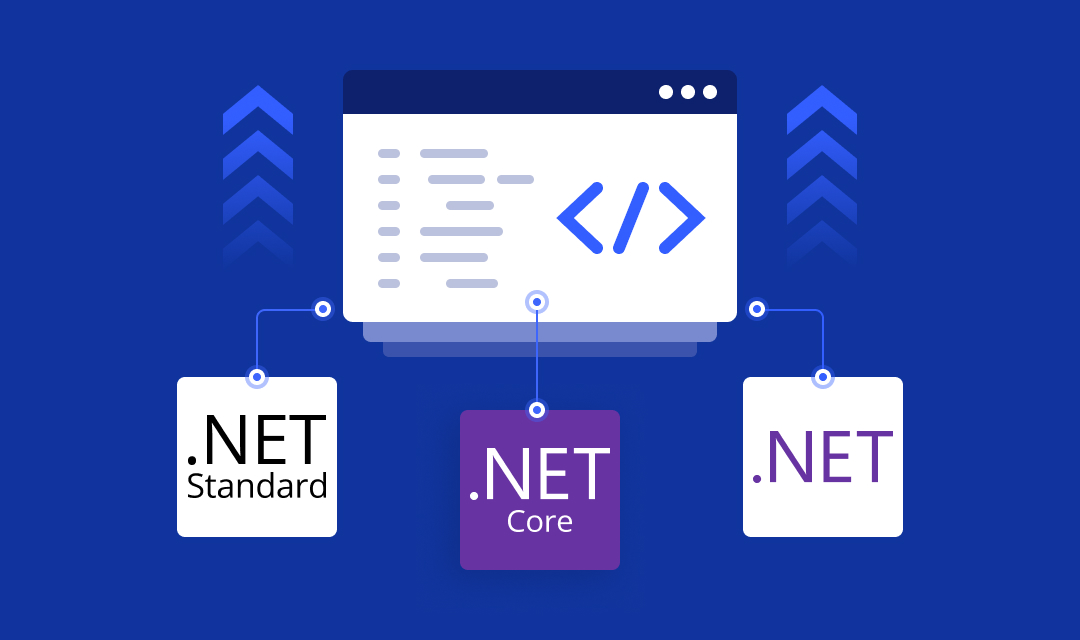
Starting with the upcoming version of our products Stimulsoft Reports.BLAZOR and Stimulsoft Dashboards.BLAZOR, we will discontinue support for .NET 5.0. This version was deemed obsolete and ceased to receive support from Microsoft as of May 10, 2022. Beginning with version 2024.2, these products will be compatible with .NET 6.0 and newer versions..NET Standard 2.1
This specification was designed to be universally applicable for apps utilizing both the .NET Framework and .NET Core across diverse platforms. With the introduction of .NET 5.0, a unified API was adopted for similar purposes, making this specification obsolete. Beginning with version 2024.2, the minimum required version for all products utilizing the .NET Core Framework will be .NET Core 3.1. Despite being outdated, it is still used in previously created and operational projects..NET 8.0
Starting with version 2024.2, we are incorporating comprehensive support for the .NET 8.0 version across all our products built on the .NET framework. While our products have functioned properly in projects utilizing this version previously, we will now compile our libraries using the .NET 8.0 SDK and update all corresponding NuGet packages. This enhancement will enable you to leverage all the features offered by the modern .NET 8.0 framework.Summary
In other words, beginning with the next version of our products built on the .NET framework, full support for compilation will be extended to the following frameworks:- .NET Framework 4.5.2
- .NET Framework 4.7.2
- .NET Core 3.1
- .NET 6.0
- .NET 8.0
For our products Stimulsoft Reports.AVALONIA, Stimulsoft Reports.BLAZOR and Stimulsoft Dashboards.BLAZOR, compilation for the following frameworks will be supported:
- .NET 6.0
- .NET 8.0
All other framework versions are also fully compatible with our products, and when utilizing libraries, their minimum required version will be loaded.
What does this mean in practice?
For instance, if your project utilizes the .NET Framework 4.6.x, then the version compiled for 4.5.2 will be used to execute our components. Similarly, if you are using the .NET Framework 4.8.x, the version compiled for 4.7.2 will be used to run our components. This principle also applies to the .NET 5.0 and .NET 7.0 frameworks, where the corresponding minimum required version will be utilized for the operation of our products.All our components undergo thorough testing and are fully compatible with all specified framework versions, including their minor updates and newer versions.
Reports.PYTHON and Dashboards.PYTHON from Stimulsoft. Soon


Wed, 07 Feb 2024 09:28:06 -0500
We are excited to announce the upcoming release of new products designed for creating reports and dashboards for applications and services written in Python! Soon, Stimulsoft Reports.PYTHON and Stimulsoft Dashboards.PYTHON will be added to our lineup of analytics and data visualization tools.
Product features
Stimulsoft Reports.PYTHON utilizes client-server technology, with a Python application on the server side and a JavaScript reporting core on the client side. These interconnected components create a unified product, making it easier to work with reports in Python-based web applications.Python
The server-side manages report files, enables working with various databases, facilitates transparent event processing, and deploys HTML and JS code on the page - all you need to do is write a few lines of code in Python.
JavaScript
The client-side is presented as a One-Page application or as an embedded component. These two modes significantly expedite the deployment process and simplify working with reports. Numerous settings are available for closer integration into existing projects.
Event handler
One standout feature of the Reports.PYTHON reporting tool is its flexible event handler, enabling you to execute necessary actions on both the JavaScript client side and the Python server side. There is no need to concern yourself with transferring data from the client side to the server side, processing it, and then transferring it back. Simply add the required lines of code to process and adjust the necessary data; everything else will be handled automatically.Stimulsoft Dashboards.PYTHON
This tool is designed for creating dashboards in services and projects written in Python. The product comprises a JavaScript data processing core, a Designer component for creating dashboards, and a fully interactive viewer for displaying completed dashboards.Main functionality
Our new product enables you to connect with various data types including SQL and file sources such as Excel, JSON, XML, and others. It offers the capability to visualize data using numerous dashboard elements, configure sorting and grouping, and export the finalized dashboard to PDF, MS Excel, HTML, and popular image formats.Dashboard designer and viewer
To create and view analytical panels, we offer designer and viewer tools.Designer
A dashboard designer is an editor for crafting a dashboard layout. It enables you to connect data, organize it further, and apply visual design elements.
Viewer
The viewer is used to view ready-made dashboards in Python applications. This component supports interactive elements, full-screen display of the entire dashboard and its individual elements, conversion to various formats, and more.
Beginning with the 2024.2 release, both products will be available for download, testing, and subsequent purchase. Should you have any inquiries, feel free to reach out to us - we are always ready to assist.
Simplified Ribbon
Tue, 30 Jan 2024 03:30:33 -0500
Today, we will discuss one important innovation in the Stimulsoft Reports, Dashboards, and Forms 2024.1 version - the ability to use the Ribbon toolbar in a single line.
We addressed this issue by consolidating all controls and commands into a compact size. Moreover, the one-line UI represents a contemporary approach to designing user interfaces in applications.

- The first option is to use the switch located in the lower right corner of the Ribbon toolbar.
- The second option is to set the Ribbon Layout parameter to Single Line UI in the Options window of the report designer on the GUI tab.
- In the reporting tools for ASP.NET, ASP.NET MVC, .NET Core, Angular, and Blazor applications:
Regardless of the option chosen, when launching the report designer for the first time, the user will always be able to change the appearance of the Ribbon panel through the GUI tab or the toolbar itself. In this case, the value will be saved in settings or cookies (depending on the product), and the designer will use them the next time it is launched. Creating interfaces that are visually appealing and user-friendly is the most crucial task in software product development. Stimulsoft developers continuously aim to follow contemporary trends and improve the usability of components.
Ribbon panel in the report designer
The Ribbon panel in the report designer is the top toolbar that contains various tabs: Home, Insert, Page, Format, and View. These tabs contain all the necessary controls and commands for creating, editing, viewing, and exporting reports and dashboards.What has changed?
Beginning with version 2024.1, it is now possible to alter the layout of the ribbon and display the UI in a single line. The classic ribbon layout has a notable drawback - the height of the Ribbon panel. When working with the report designer in a non-full-screen mode, the toolbar may occupy considerable space. Therefore, interface developers consistently encounter a dilemma between compact size and functionality.We addressed this issue by consolidating all controls and commands into a compact size. Moreover, the one-line UI represents a contemporary approach to designing user interfaces in applications.
How do I switch the Ribbon panel to a single line?
To switch the toolbar to a single strip, you can utilize one of the following methods:- The first option is to use the switch located in the lower right corner of the Ribbon toolbar.
- The second option is to set the Ribbon Layout parameter to Single Line UI in the Options window of the report designer on the GUI tab.
Additional Options
In version 2024.2 of Stimulsoft Reports, Dashboards, and Forms, special options will be available for installing either version of the Ribbon panel in the report designer before its initial start:- In the reporting tools for ASP.NET, ASP.NET MVC, .NET Core, Angular, and Blazor applications:
StiDesignerRibbonType.DefaultRibbonType = StiDesignerRibbonType.SingleLine;StiOptions.Designer.Ribbon.RibbonLayoutType = StiRibbonLayoutType.SingleLine;designerOptions.appearance.defaultRibbonType = StiDesignerRibbonType.SingleLine;Regardless of the option chosen, when launching the report designer for the first time, the user will always be able to change the appearance of the Ribbon panel through the GUI tab or the toolbar itself. In this case, the value will be saved in settings or cookies (depending on the product), and the designer will use them the next time it is launched. Creating interfaces that are visually appealing and user-friendly is the most crucial task in software product development. Stimulsoft developers continuously aim to follow contemporary trends and improve the usability of components.